
Clinical Trial Prediction
Predicting the outcome of clinical trials with machine learning.
Python, Mahine Learning, Tableau
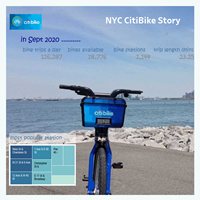
NYC Citibike Story
Interactive dashboard about NYC citybike past and present.
Tableau
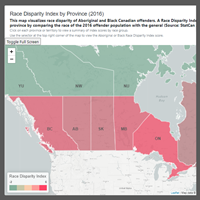
Incacerated Population
Study about race disparity among Canada's offenders population.
MongoDB, JavaScript, HTML, CSS, Leaflet, Plotly
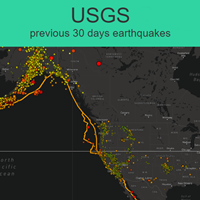
Interactive-Maps
Vizualizing the last 30 days earthquake with Leaflet.
Leaflet, JavaScript, HTML
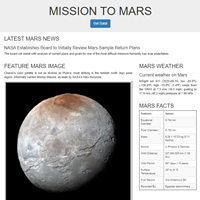
Mission to Mars
A web application that scrapes Mars related data and images, and displays in a dashboard.
Python, MongoDB, Flask, HTML
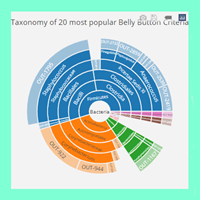
Belly Button Biosphere
An interactive dashboard to present the project's dataset.
Javascript, Plotly, HTML
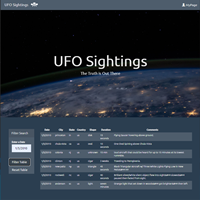
UFO Sightings
Interactive table with capability to allow users to filter the table data for specific values.
JavaScript, HTML, CSS, D3.js
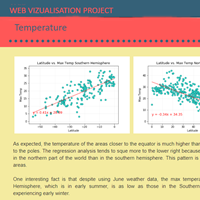
Web Visualization
An HTML Dashboard to present Latitude Analysis projects.
HTML